Apart from a suitable project management method, the right tools are crucial for the success of projects. Deciding on one method and a matching tool often appears to be easier than it is - especially when it comes to project management tools. There are plenty of options: boards, lists, structure trees, timelines. But what tools do you actually need for your project? To shed some light on the subject, let's take a closer look at a very popular tool today: the Gantt Chart.
What is a Gantt Chart?
A Gantt Chart is a bar chart that is often used in project management. Project plans, including all activities and events in their chronological course, can be easily displayed graphically. Deadlines and dependencies are visibly highlighted allowing you to quickly identify bottlenecks.
The Gantt Chart was developed as early as 1912 by its namesake Henry L. Gantt, an American engineer. A clever man with clear visions, as it turned out later. The planning of immense construction projects, such as the Hoover Dam, for example, was illustrated with the help of Gantt Charts. An instrument that was used in the construction of a dam of this size should certainly be helpful for smaller projects as well, right?
What can be read from a Gantt chart?
Gantt Charts are suitable for visualizing a wide variety of projects and their progress. With the help of the chart, the total duration of a project can be determined and team members can get a clear overview of the current status at any time.
Basically, everything in Gantt revolves around axes: The vertical axis represents the activities / tasks / project steps, while the horizontal axis describes the temporal course. The correlation of the two parameters is now entered into this system in the form of bars. Depending on the duration of the activities, a different bar length can be obtained
In addition to this classification, modern Gantt diagrams usually contain a function to show the dependencies between individual project steps, responsibilities, and milestones.
So can bar spans also overlap? Of course, because after all, tasks are often processed simultaneously.
What information can be read from a Gantt chart?
- Project duration: Start and end of the project
- Task / process duration: Start and completion of individual tasks / project steps
- Responsibilities of individual tasks
- Task descriptions
- Dependencies of individual tasks / project steps
What does a Gantt chart consist of?
Depending on the project or software used, the terms may differ.
- Task list: Arranged along the vertical axis on the left side of the diagram, it lists all the activities necessary to execute the project.
- Timeline: Running horizontally at the top of the diagram, it represents a certain time span of the project.
- Dateline: The dateline runs vertically through the diagram and represents the current point in time (date or time) during the course of the project.
- Task bars: Tasks, as well as their durations and deadlines, are mapped using horizontal bars within the diagram.
- Milestones: Important events and their deadlines are usually represented as diamonds in the diagram.
- Dependencies: Linear linking elements between tasks / process steps specify a fixed sequence.
Application and advantages: What are Gantt Charts used for?
Gantt Charts are used in almost all industries and business sectors, where the scheduling of individual tasks often depends on the completion of other tasks. For example, Gantt Charts are useful in/during:
- complex projects for product launching (e.g. software development)
- event planning
- the implementation of marketing & PR campaigns
- construction projects
Those who use a Gantt Chart want to benefit from certain advantages in the planning process. The Gantt chart helps you to...
- keep an eye on the progress of projects,
- identify potential bottlenecks,
- improve the project schedule,
- optimize the entire process structure,
- predict delays, and
- to keep all project participants on track.
What is the difference between Gantt Charts and calendar views?
At this point we would like to clarify that a Gantt Chart is not a calendar view. Both views focus on the time-related context, but the Gantt Chart deals very centrally with the connection between the individual work steps. While the calendar only provides individual weekly or monthly views for a better overview of daily tasks, the Gantt Chart provides the user with a clear overview of how changes would affect other tasks and the overall progress of the project.
The following table illustrates the differences and shows you in which cases the calendar or the Gantt Chart is more suitable.
| Process criteria |
Gantt Chart |
Calendar function |
| Time limits |
It is a project by general definition, i. e. with start and end dates. |
The project is not explicitly limited in time, i. e. it is continuous. |
| Monitoring |
The aim is to complete the overall project on schedule. The focus is on the progress of the project. |
The aim is to keep track of upcoming to-dos. Thus, only an overview of all currently pending tasks should be displayed. |
| Task processes |
The project contains several different tasks, which are often dependent on other tasks and thus must be completed in a predefined order. Deviations in the processing of one task would inevitably affect other tasks. |
Tasks related to the project are usually independent of the completion of other tasks. Deviations in the processing of one task would not affect other tasks or events. |
| Target group |
The view should serve as a tool for all stakeholders of the project to inform the respective groups of people about the current status. |
The view is designed to give the team an instant overview of what tasks are currently in the pipeline. |
Of course, in certain situations both views can be helpful. However, it is important to remember that the views have different purposes.
What should you pay attention to when creating a Gantt Chart?
If you want to support your project management with Gantt Charts, you should pay attention to a few things - because creating them requires a certain amount of preparatory work. Requirements should be precisely defined and prioritized in advance. This is the only way to ensure that the timeline is set up correctly. Next, a project plan must be created, i. e. an exact list of all tasks / process steps, with priorities, dependencies, duration, and deadlines.
How does a Gantt Chart Software help?
The times when project management processes were supported by sticky notes are over. Almost all steps of project planning are carried out digitally. Some project management software offer their own Gantt Chart views, including Stackfield. But what advantages does a Gantt software offer compared to a classic creation in Excel?
Location and time independent access to the Gantt Chart
Considering the changing world of work, the most obvious advantage of Gantt software becomes apparent. Teams work together across locations, home office in companies is becoming a standard, and globalization is even making collaboration between managers in different time zones an everyday scenario.
When using software like Stackfield, team members can access the Gantt Chart at any time, no matter where they are currently located. This not only makes general collaboration more agile but also ensures that no one loses track of the project's progress.
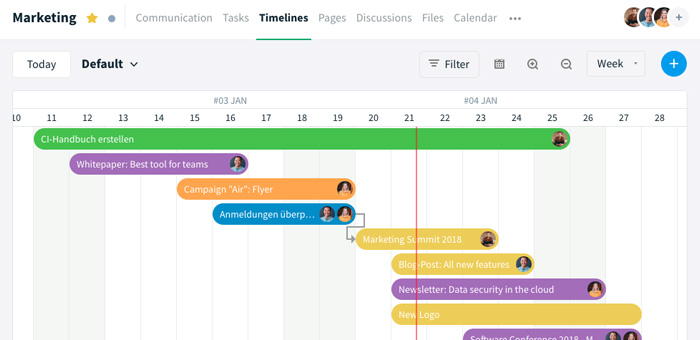
Our software links Gantt Charts with team task management
The Gantt Chart in Stackfield does not simply stand alone - it is linked to other tools within the platform. For everyday work, this means that all updates within the team's task management are visible on the Gantt Chart. If any changes and/or delays in processing appear, the Gantt Chart does not have to be updated separately. The software automatically handles this part for you and keeps the progress and effects of changes visible for everyone.
Keep all information in sight with Gantt charts
Since the Gantt Chart is built from the task cards, which contain all key data, files, and documents in Stackfield, the corresponding information is directly available via the Gantt Chart. This prevents team members from having to switch between different views too often.
Gantt Software: How to create a Gantt Chart on Stackfield
A detailed project plan is essential for the creation of a Gantt Chart. Therefore, create a catalog of requirements and think carefully about the tasks that need to be completed during the project. Be aware that three important components of the project - the scope, the resources, and the time factor - are correlated. As soon as one of the components changes, the other two will inevitably be affected.
Create a detailed list of tasks and prioritize
In the first step, you should create a list as precise as possible of all tasks. A division into larger process sections can be useful here. Consider what is necessary to complete each process and then formulate it in the form of tasks.
You can create tasks on Stackfield directly in the module Timeline or via the modules Communication, Calendar or Tasks. The cards view within the module Tasks is great for giving yourself an overview of the big picture: You can first add all tasks to the "To Do" status column and then simply drag and drop them into the right order. This way you will get the most accurate prioritization possible, which will help you especially when it comes to dating the tasks. Labels can be helpful as well, provided you divide the tasks into broad project sections.
Determine the task duration and date
Once the order is determined, you can start setting due dates for the tasks. First, you should think about the duration of the individual tasks, also consider buffer times.
Stackfield allows you to set due dates and periods directly via the task card. A more convenient option may be found in the module Timeline: Here, you can display tasks without due dates ("Unscheduled Tasks") via the calendar icon at the top of the view and add them to the Gantt Chart with just one click. In the Gantt Chart itself, you can then drag and drop the task to adjust its duration and move it to the right time.
Set milestones
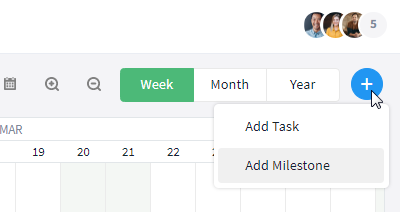
Important intermediate dates and milestones can be added as milestones to most Gantt Charts. Simply click on the plus symbol in the timeline module and select "Add Milestone".
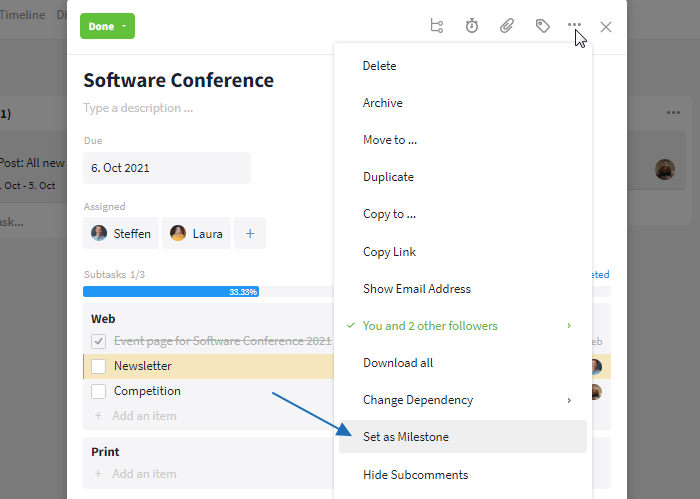
Alternatively, you can convert existing tasks into milestones. Simply open the corresponding task, click on the More button (symbol: three dots) in the upper right corner, and select the option "Set as Milestone".
Define dependencies
Finally, the central part that really makes the Gantt chart a Gantt Chart: the task dependencies. To visualize the project plan in the best possible way, all interrelationships between tasks should be considered. Thus, if tasks depend on the completion of other tasks, it is necessary to establish a dependency relationship between them.
Dependencies can also be created in Stackfield's timeline module via simple drag and drop. Just drag the dependency from the predecessor task to the successor task.
For better understanding the dependency relationship: The dependent task is always the task to which the dependency arrow points. The task that the arrow points away from must therefore be completed first.
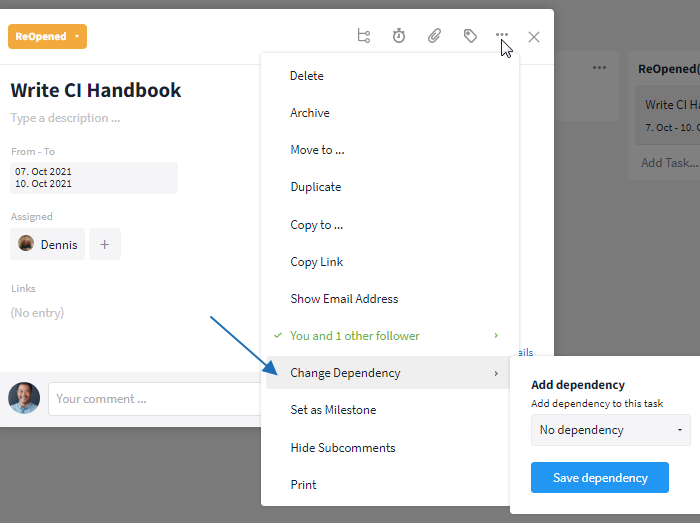
Alternatively, you can open the corresponding task cards and enter the dependency manually via the More button (symbol: three dots). Simply click on "Set dependency" and select the corresponding task via the search mask. You can add as many dependencies to and from the same task as you like.
For better understanding the dependency relationship: The opened task is subsequently dependent on the task that was selected via the search mask.
Keep an eye on the progress
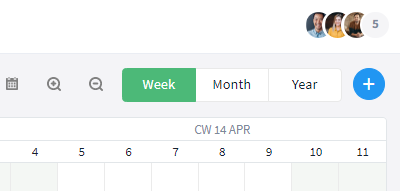
Having completed the Gantt chart, you now get the total project duration. You can display your project in a weekly, monthly, or yearly view.
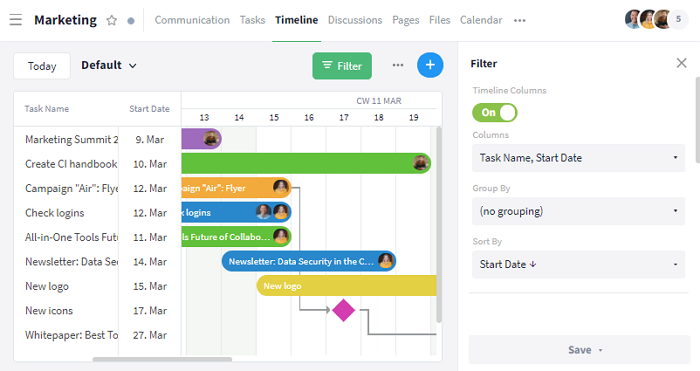
Various filter options help you individualize the Gantt view. For example, the task list (mapping of task names / start and end dates / duration) can be restricted or extended as desired.
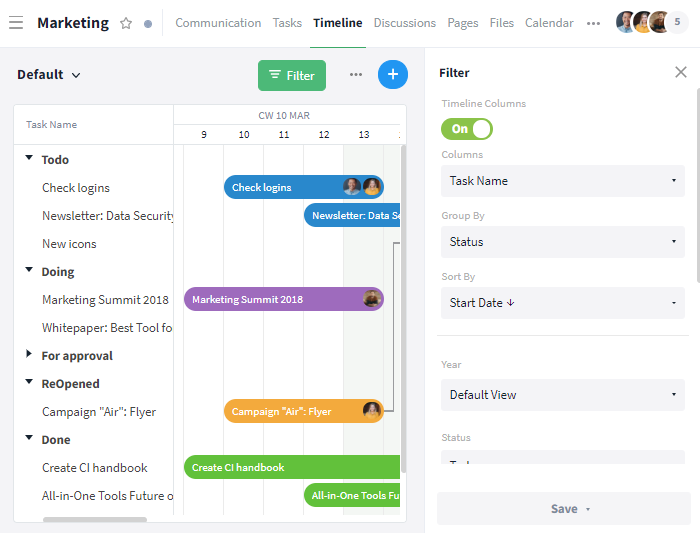
Furthermore, tasks can be grouped by status and sorted based on the various criteria of the task list.
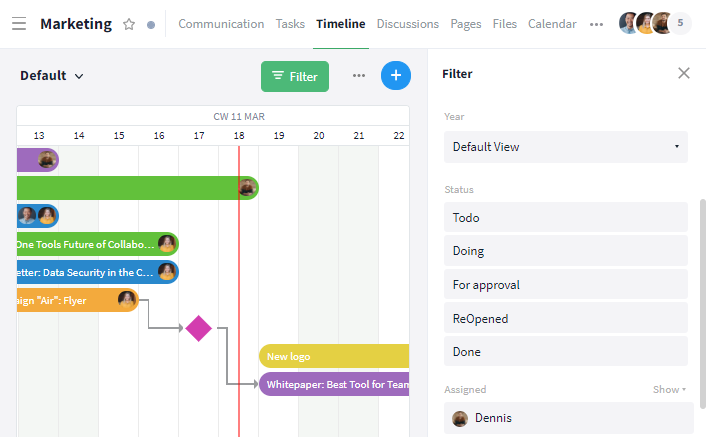
Finally, the entire view can be narrowed down in terms of its period, various status options, and responsible members.
The Gantt Chart is one of the most helpful tools when it comes to tracking project progress. If you take your time when creating the chart and do the important groundwork in form of a project plan, you can benefit during the implementation.