You may have already noticed: The new customer stories have really shaken up our blog lately. Our customers have been telling us all about their favorite Stackfield features and how they're applying the tool in daily work. Surprisingly, when asked "What is your favorite feature?" we often got a similar or identical answer: the Kanban Board and the project rooms. We quickly realized that more progress should be made in these areas.
All new functions at a glance:
- Structure your Kanban board with Swimlanes on a horizontal level.
- Store a time and/or money budget to get a financial overview on each individual room member in the project details of your project room.
- Map multiple projects over time using the Gantt view in the project portfolio.
- Add cover images to your task cards.
- Disable read receipts in the organization's settings.
Two is better than one: Group twice with Swimlanes
All tasks are nicely organized in the Kanban Board and you're still missing an overview because the columns are overflowing. Does that sound familiar to you? With the new update rescue is on its way: Using Swimlanes, you can group your tasks within the columns according to a second criterion. And here's how you do it:
1. Decide according to which of the four criteria you want to group your columns and according to which one you want to group your swimlanes:
- the processing status (e.g. "To do") of the tasks,
- the due date (e.g. "Today" or "Overdue") of the tasks,
- the self-defined criteria of your custom field "Dropdown" (e.g. topics or priorities) and/or
- the users deposited via the custom field "User".
Tip: To ensure that each task can subsequently be assigned to exactly one criterion, only groupings or swimlanes based on single-select fields are possible. Single-select refers to fields that allow only one selection option. If you still want to group by multiple-select fields, create them as user-defined fields. For example, you can create labels using the "Dropdown" field.
2. Next, open the filter of the tasks module and select the corresponding options under "Group by" and "Swimlane by". The first grouping takes place in the form of columns (by default: Status) while the second grouping is performed horizontally in the form of swimlanes.
3. Your Kanban board will now be adjusted to your settings. If necessary, hide swimlanes to further minimize your view.
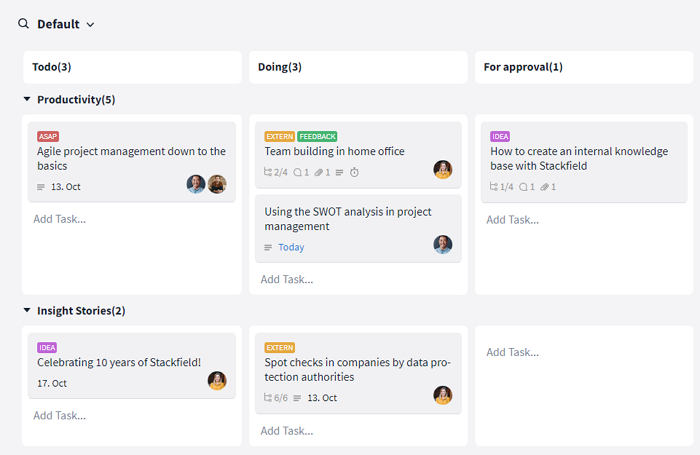
The Swimlanes group your tasks on a horizontal level
Everything financial at a glance - even during project work
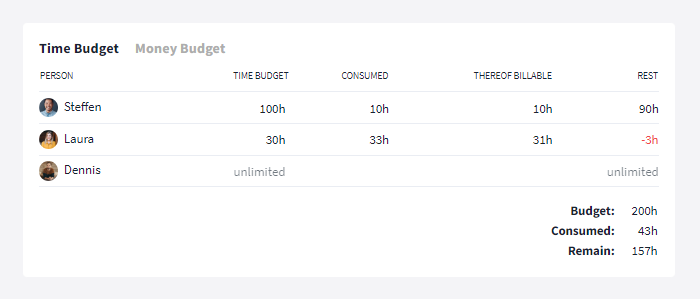
In projects, external staff, e.g. freelancers, are often brought into the team on an hourly basis. The disadvantage: All hours must be considered and billed individually. And who are we lying to? No one likes to sit down at the end of the project to do a bunch of billings. To make sure you can benefit from Stackfield's time tracking in project work, you now get a separate overview of each room member's time and money budget in the room's project details.
Time budget
The time budget of a project indicates how much time in hours should be invested in the project. You can specify the time budget in the upper area of the project details. In the "Time Budget" view, all room members are listed and can be viewed with a separate time budget. The overview contains the following criteria:
- Time Budget: How much time should the user spend working on the project?
- Consumed: How much time has the user already invested in the project? (Results from the time entries of the user)
- Thereof billable: How many of the user's consumed hours can be billed? (Can be set individually for each time entry)
- Rest: Difference time budget - consumed
At the bottom right, you will see a summary of the total time budget of the project, the sum of the hours spent by each user, as well as the difference between the two components.
Time budget and hours spent at a glance
As soon as the time budget of a single user or the entire time budget of the project has been exceeded, the (now) negative difference is displayed in red and a note is shown at the top of the project details.
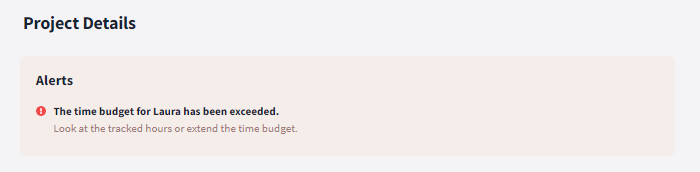
The time budget has been exceeded
Money Budget
With the money budget you can define the maximum amount of money that can be spent on the project. In the view "Money Budget" you have, similar to the time budget, the possibility to view each user individually.
Via "change" in the first column you can define a general default hourly rate for the project. If necessary, the hourly rate can then be overwritten for individual users at any time. In addition to the hourly rate, the sum of the billable hours of each user is displayed. Just like in the time budget view, it is calculated from the time entries of each user. The "Total amount" column finally calculates the product of hourly rate and billable hours.
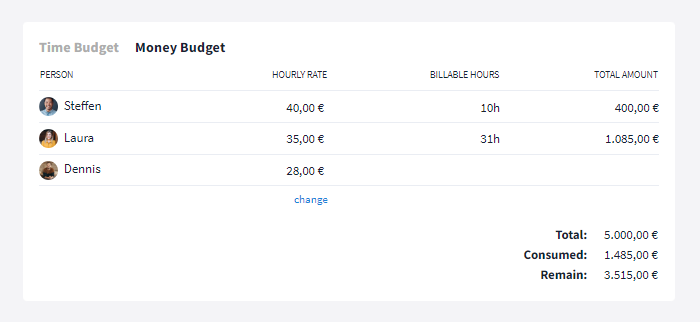
Money budget and generated costs at a glance
At the bottom right, you get a summarizing overview: The total money budget of the project is put in relation to the sum of the costs caused by the users and shown with the remaining amount. If the difference is negative, a warning message is triggered, as in the time budget view.
Time and money budget as columns in the project portfolio
In the project portfolios you will find a list of all your projects as usual. In the individual columns, you were already able to show a number of details and compile an individual overview. With the time and money budget some additional options are now available:
- Time Budget: How much time in hours is planned for the project?
- Money Budget: What is the budget for the project?
- Tracked Time: Total hours consumed by all users
- Tracked Money: Sum of generated costs by all users
- Time spent: Ratio of hours consumed vs. residual budget
- Money spent: Ratio of generated costs vs. residual budget
Your projects as a Gantt chart
In the project portfolio, all your projects are displayed as a list view. With this update, a second view - the timeline - is now available. Here, a Gantt chart displays all projects in their chronological course. Each project is represented by its own bar. The length of the bar depends on the defined project length and the color represents the status of the project. With a double click on a bar, you can retrieve the project details of the corresponding room.
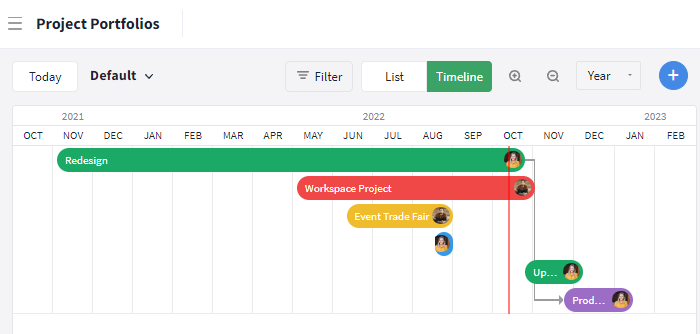
All projects in their chronological course
The individual projects can be placed in dependence to each other. There are four different possibilities:
- Finish to Start: The arrow is drawn from the end of the first project to the start of the second project. If the second project is started before the end of the first project, a warning message appears.
- Start to Start: The arrow is drawn from the start of the first project to the start of the second project. If the second project is started before the start of the first project, a warning message appears.
- Finish to Finish: The arrow is drawn from the end of the first project to the end of the second project. If the second project is finished before the end of the first project, a warning message appears.
- Start to Finish: The arrow is drawn from the start of the first project to the end of the second project. If the second project is finished before the start of the first project, a warning message appears.
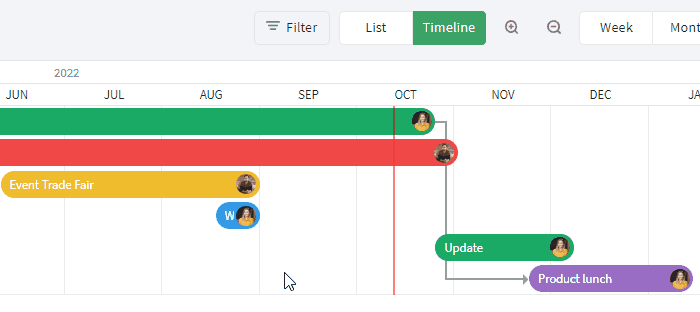
You can create dependencies between projects
Visualize tasks with cover images
To make the contents of a task visible at a glance, you can now display image files attached to tasks as a cover image in the respective task map in the Kanban Board. By right-clicking, you can edit the settings of each task. By default, when uploading a new image file, it will automatically be displayed on the map ("Show most recent" option). Alternatively, you have the option to set a specific image file as the title image (click on the file name) and thus stop the automatic upload. With the option "Show no image" you can remove an existing title image or deactivate the default setting for the corresponding task.
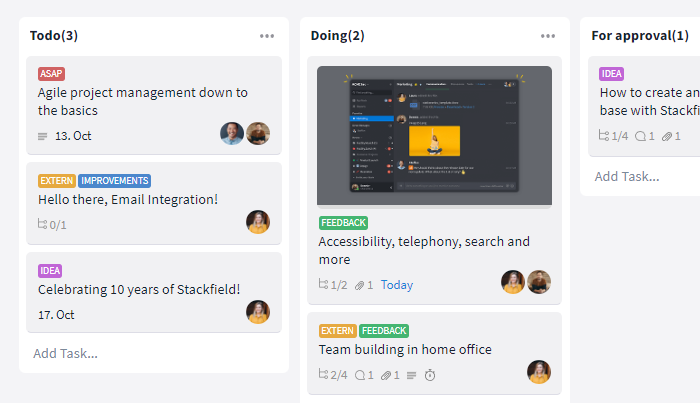
Contents in the Kanban Board can be visualized with cover images
If you don't want title images in the task cards of a room, you can, as an admin of the room, disable the feature in the room's settings.
Have you seen this already?
As soon as you open a message on Stackfield, the other person gets a read receipt. In 1:1 chat it even includes date and time. Most of the time, this is pretty useful, but it can also put pressure on you to reply as soon as possible.
Admins of your organization can now disable read receipts for all users of the organization for this or other reasons. You can find the corresponding setting in the tab Settings of the "Organization Settings".
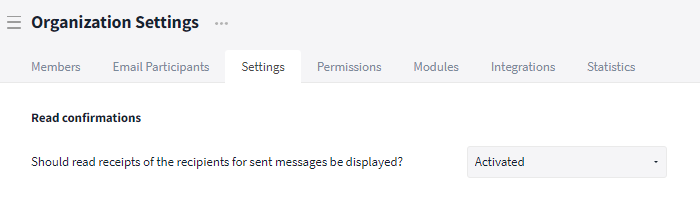
You can disable read receipts on organization level
Almost finished...Please click the link in the email and confirm your email adress to complete the subscription process.
Never miss a post. Get awesome insights in your inbox.