The modul "Timeline" makes it easy to create and optimize task sequences and / or project plans and to keep an eye on progress and the overall duration (of the project). Potential bottlenecks are visible at a glance and can be prevented in good time. Everyone involved is kept up to date at all times and knows what needs to be done and when.
Basics of the Gantt view (structure / colors)
The Gantt view is a bar chart that is often used in project management and other planning (e. g. in production or social media marketing) and shows all tasks over time and in relation to other tasks.
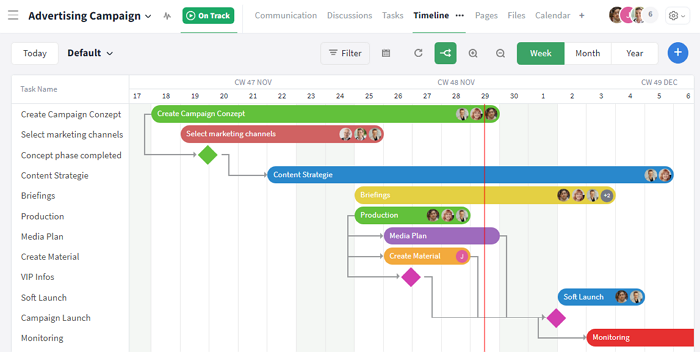
The diagram helps to put all tasks in the "right" order
What does the view consist of and what can I read from it?
Overall, the view is divided into different areas. These are listed below and are numbered consecutively in the screenshots for better understanding.
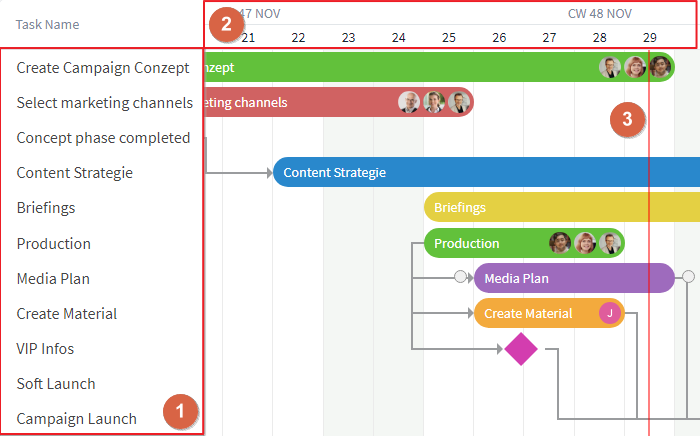
(1) Task list; (2) Timeline; (3) Dateline
(1) Task list: The vertical axis of the diagram shows all tasks (or events or project steps). One task is displayed per line. Additional columns (e. g. the name of the task – see screenshot) can be displayed or the tasks can be sorted, grouped or restricted using filters.
(2) Timeline: The horizontal axis shows the progression / time span of all scheduled tasks. For projects, the "actual" total project duration can be determined by the time of the first and last task (vs. "planned" start and end date).
(3) Dateline: The dateline (red) shows the current point in time and runs vertically within the diagram.
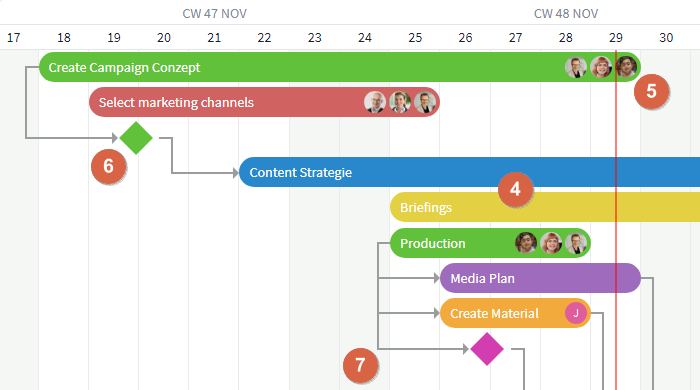
(4) Task bar; (5) Responsibilities; (6) Milestones; (7) Dependencies
(4) Task bars: Within the schedule, all tasks are visualized and arranged by due date in the form of bars – i. e. they are put "in the right order". The title of the corresponding task can be read from the bar. If the bar is too short for the title, it can be faded in via mouseover. Depending on the length (→ due date "From – To"color is determined by the status or the room / room group.
(5) Responsibilities: The profile picture within a bar shows who is responsible for the task, i. e. to whom it has been assigned. Further details about the task, including the display name of the assigned person(s), can be viewed in the open task. If only the initial of a person is displayed instead of a picture (example: the "Create Material" task in the screenshot), the user in question has not yet entered a profile photo. If there is no profile picture at all (example: the "Media Plan" task in the screenshot), there is no assigned person yet.
(6) Milestones: Important events or intermediate steps, so-called milestones, are accentuated as diamonds (in project rooms also in the project details).The color of the milestones is defined by their status: open in pink, completed (processing status "Done") in green and from the "critical path" in red.
(7) Dependencies: Connection arrows indicate a certain sequence for the completion of tasks / milestones. They show which entries are dependent on the completion of others."Successors" can therefore only be processed once the "predecessors" have been completed.
What is the meaning of the task colors?
In the room:
The colors of the tasks in the Gantt chart vary depending on the status of the task. Completed tasks, for example, are displayed in green. The status and therefore also the color of the task can be changed in the task cards.
If the "critical path" is activated, affected tasks are highlighted in red.
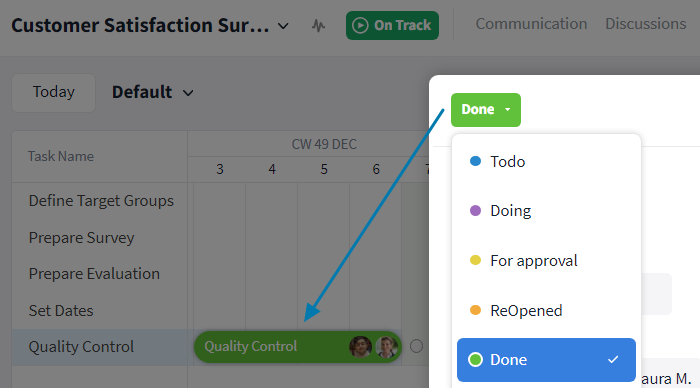
In the room, the color of the task depends on its status
In the reports:
In the reports, on the other hand, the colors of the tasks refer to the rooms from which they originate or to the room group to which this room belongs (the color of a room group is always inherited by its rooms). In the following screenshot, for example, the "Job Application" room is shwon in yellow and the "Regular Project Meetings" room in blue.
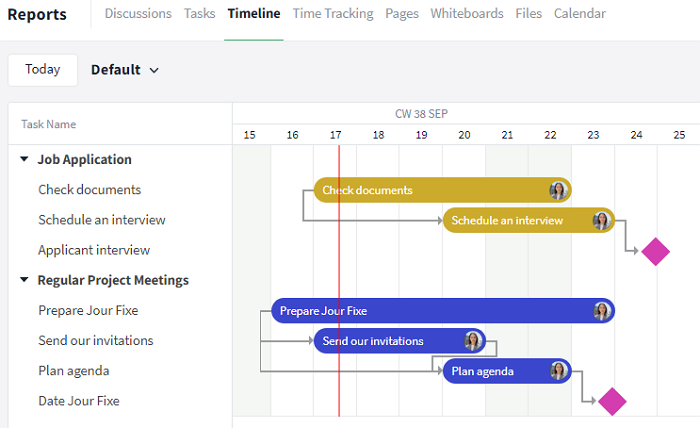
Tasks from the same room are displayed in the same color in the reports
Note: In the screenshot shown here, the filter option was used to group by "Rooms". For this reason, the room name is highlighted in bold in this display when the task names are grouped.
What is a milestone?
Milestones can have many different functions:
- Relevant intermediate steps (e. g. within a project phase) that can be used to monitor progress
- Marking the start, release or completion of a phase / stage within the project
- Important fixed dates and events (e. g. submissions or delivery dates)
In most cases, milestones behave like tasks, except in the case of due dates / presentation and automatic planning. Milestones should not contain any activities – i. e. no task steps. It is best to create a separate task for this.
To identify related tasks that lead to a milestone, these can be marked via a selection list (e. g. a custom field) and / or a dependency.
Creating, opening and removing tasks / milestones
The Stackfield modules are interlinked and interconnected. Tasks / milestones (see "Basics" for the meaning and visualization) can be created, changed or deleted in various ways, but they only appear in the schedule when a due date is assigned.
Procedure in the overview of the schedule module
New tasks and milestones can be created in the schedule module by clicking on the blue plus symbol and selecting the corresponding option.
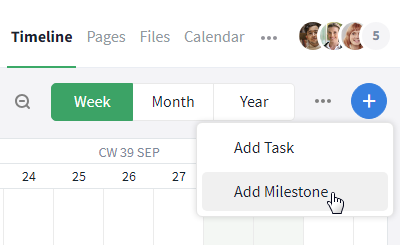
Create a task or milestone in the schedule module
If a task / milestone already exists but does not yet have a due date, it will not be displayed in the Gantt view. Such "unscheduled" tasks / milestones can be added via the "Calendar" icon. Clicking on the icon opens the list of entries that are not yet scheduled, from which the desired entry can be selected and transferred to the Gantt chart by clicking on "+ Add". They are assigned to today's date and the due date can be subsequently adjusted if necessary.
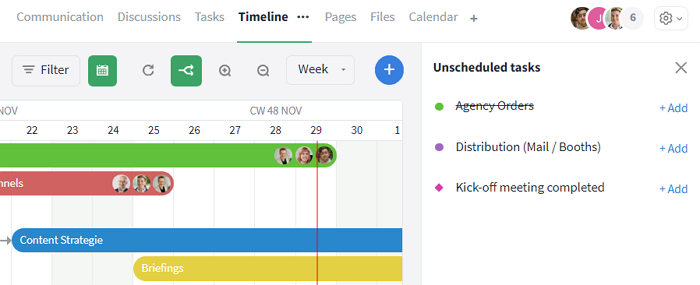
Add unplanned tasks via the calendar icon
In addition, existing tasks can be converted into a milestone and vice versa. This is possible by right-clicking on the relevant task in the Gantt view to open all available options and selecting the "Mark as milestone" option. If a period is defined for the tasks due date, the start due date is adopted for the milestone.
To remove the milestone status in the Gantt view, right-click on the relevant milestone and deselect the "Mark as milestone" option. The green tick now disappears and the milestone becomes a regular task again.
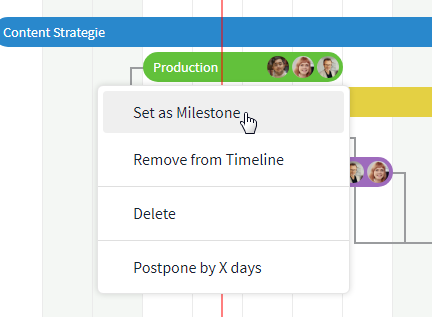
Mark tasks as milestones (in the Gantt chart)
With the "Remove from schedule" option, the due date of the task / milestone is removed and the entry is thus hidden from the Gantt view. This action means that the entry can still be found in the Tasks module; it has not been deleted. The "Calendar" icon can be used to add the "unplanned" task to the schedule again.
Procedure in the open task
Alternatively, tasks can also be created in other ways (e. g. in the task or calendar module) using the respective plus button.
The created tasks can then be opened and changed in the room / report by clicking on the entry (e. g. left-double-click on the bar in the schedule or left-click on the card in the Kanban board of the task module).
By selecting "Due by" and entering a date, previously "unplanned" tasks are automatically added to the schedule or removed again by deleting the due date.
To
convert the open task into a milestone (symbol: pink diamond), select the "Mark as milestone" option via the "more" button (symbol: three dots) at the top right of the task card. The milestone status can also be removed again in the same way; the green checkmark in the selection and the diamond of the milestone disappear.
Mark the task as a milestone and remove it (in the task card)
Dependencies between tasks / milestones
Dependencies act as a link between individual or multiple tasks i. e. milestones. They are intended to ensure that interdependencies are taken into account and indicate the effects that changes to the schedule will have. This allows you to plan the optimal process and the fastest route through the upcoming activities.
Create and view dependencies
Prerequisite: Dependencies can only be used if the schedule module is activated and for tasks / milestones with a due date.
Dependencies can be created in the schedule overview or via the open entry (also via other modules such as "Tasks").
To create a dependency in the Gantt view, hold down the mouse button and drag an arrow from the link point (visible on mouse-over) of a task / milestone to the link point of the other entry (see possible types).
Create dependencies using drag and drop
The dependency and its direction are shown by an arrow. The entry from which the dependency arrow leads is the predecessor (here: "Create event plan"), i. e. it must be completed first. The entry to which the arrow points is the successor (here: "Book location"), the processing of which is dependent on the predecessor.
Alternatively, dependencies can also be created via the successor itself. To do this, open the task or milestone and click on the more button (symbol: three dots) at the top right. Now select the "Add dependency" option and click on the desired predecessor(s) in the search mask. The dependencies entered are then highlighted in blue and listed in the header area of the successor (regardless of how they were created).
View dependencies in tasks
The different types of dependency
There are a total of four different ways in which the dependencies between the entries can be set. There is a linking point on the left (start due date) and on the right (end due date) for both the predecessor and the successor, which can be linked together. The options are illustrated below (predecessor = green / successor = orange) and explained with examples.
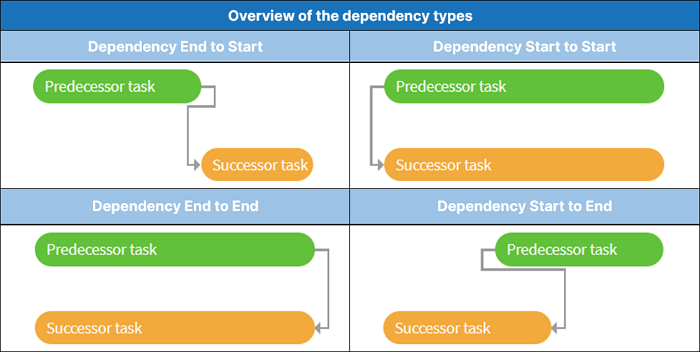
The different types of dependencies
Dependency: End to Start (normal sequence)
The successor cannot start before the predecessor has ended, but can also start later. This dependency is the most common type among the dependency types and is used in the waterfall method, for example.
Example: A text can only be published (successor) once it has been written (predecessor). However, it can also be published later.
Dependency: Start to Start (initial sequence)
The successor cannot start before the predecessor starts, but can also start later. The start-to-start dependency is used for entries that can be executed in parallel.
Example: A text can only be written (successor) once the research has also been started (predecessor). However, writing and researching can take place in parallel.
Dependency: End to End (end sequence)
The successor cannot be completed before the predecessor has been completed, but can also be completed later.
Example: A text can only be fully proofread (successor) once it has been completed (predecessor). However, the proofreading can take place parallel to the writing process.
As an alternative to this dependency, subtasks can be used for sub-steps. These must also be completed before the main task can be fully completed.
Dependency: Start to End (jump sequence)
The successor cannot be completed before the predecessor has been started, but can be completed later. This dependency is used when an overlap is needed, for example in retail and in professional fields with shift work or to cover continuous support.
Example: An employee in customer service cannot finish their work or go on their lunch break (successor) before a colleague has started their shift (predecessor) so that someone is always available. However, the employee can also finish work / take a break later.
Note: There can only ever be one type of dependency between the same entries. The system recognizes cycles that have contradictions in their condition and prevents them.
Complete tasks with dependencies
The basis for working with a Gantt chart is the understanding that all tasks should be completed according to the defined sequence and taking into account their dependencies (i. e. setting processing status to "Done"). For this reason, users in Stackfield receive a corresponding message when they try to complete successors in advance.
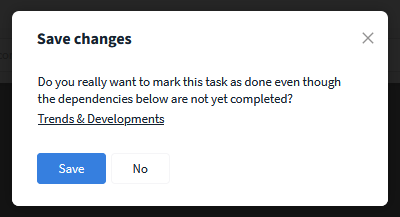
Note for open predecessor tasks
Remove dependencies
It is possible to either delete dependencies individually or (if several dependencies exist) to remove all dependencies of a successor to its predecessors collectively.
Individually:
In the schedule overview, dependencies can be deleted by
right-clicking on the corresponding
dependency arrow and selecting the "Delete dependency" option.
Alternatively, a dependency can also be removed in the open entry. All dependencies are listed in the header of the successor; click on "Delete dependency" for the desired dependency. Dependencies can also be changed using the more button (symbol: three dots) at the top right. Existing dependencies are highlighted in blue and can be deleted by clicking on them.
Solve dependencies individually in the diagram or in the task
All:
All dependencies can also be deleted from the overview by
right-clicking on the successor and selecting the "Delete all dependencies" option.
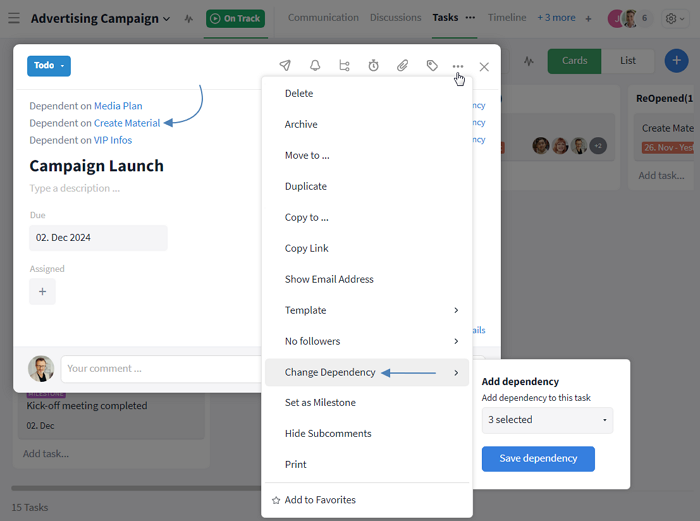
Alternatively, several dependencies can also be deleted together in the open successor. To do this, click on "Change dependency" via the more button (symbol: three dots) and select the option "No dependency" from the list that opens.
Solve dependencies collectively in the diagram or the task
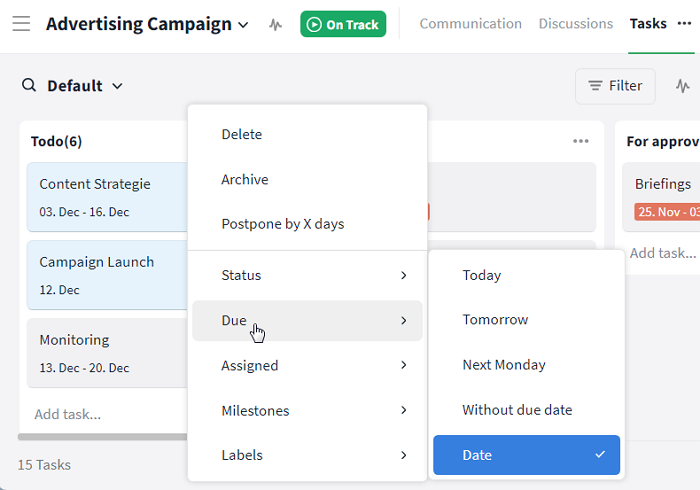
Changing the deadline (manually / automatically)
The due date of entries that have already been created can be changed at a later date. This is possible via the open entry or in the overview of the respective module. The options from the overview of the schedule module are explained below.
Please note that only scheduled tasks / milestones are displayed in the Gantt view itself and that entries without a due date must be added separately.
Individual change(s)
If a due date is to be changed, dated tasks and milestones in the overview of the Gantt chart can be moved to the corresponding date using drag and drop.
For tasks, the period / duration entered can also be extended or shortened by dragging at the end of the task bar.
Schedule tasks using drag and drop
Customize multiple selected entries
In addition to manually moving individual tasks / milestones using drag and drop, several entries can also be moved collectively.
To do this, select the desired tasks / milestones by selecting them multiple times and then right-click to open the menu for selecting the move.
With the "Move by X days" option, the selected entries are moved forward (into the future) by any number of days from their original due date; the distance between the entries is identical. This is possible for "loose" entries and entries linked by dependencies. If a time period has been defined for tasks, the start and end dates are moved equally. Weekends are not skipped with this option.

Move multiple tasks / milestones at once
In both the Schedule and Task Modules, there is also the option to move multiple tasks to the same start date, regardless of their original start date.
Adjust the due date of several tasks / milestones at once
Changes using automatic planning
With the "automatic planning" function, dependent entries can be automatically adjusted to each other when the due date changes.
A click on the button with the "round arrow" (at the height of the filter) activates the function. The icon turns green. All changes are now automatically taken into account. This means that as soon as a task / milestone is moved in the due date, all entries dependent on it (successors) are moved to the next earliest possible date.
The due date of a successor task is based on the end date of its predecessor
Only working days are taken into account: If the start of a "From – To" task falls on a working day and the end on a weekend, the period is extended and the end is moved to a working day. If a task falls completely on a weekend, it is moved directly to the following Monday.
No "working day" is intended for milestones. As a result, several milestones can end up on one day due to a postponement. If work steps are scheduled for a milestone, it is best to create a separate task for this.
Optional extension: It is possible to adapt the automatic planning to your own requirements and needs. A corresponding article will be published shortly.
Recognizing bottlenecks with the critical path
The critical path represents the longest chain of linked entries that are necessary for the overall completion (e. g. of a project) within the time frame. It therefore also defines the minimum period required for the completion of a project or activity.
With the help of the critical path, risky points in the schedule can be identified at an early stage so that suitable (counter)measures can be taken if necessary. This is because the critical path makes tasks / milestones without a buffer period visible at a glance.
To activate, click on the button with the "two arrows" (at the height of the filter), which then turns green. From now on, all entries (one or more, including dependencies) that could cause a delay in the overall process or jeopardize success will be marked in red. The critical path is recalculated each time the due date is changed. Pay particular attention to the due date for tasks / milestones marked in red.
Critical tasks and dependencies are shown in red
In the example above, the "Prepare Evaluation" task is initially the only one marked in red, as it represents the end of the task string. If it is scheduled one day earlier, the two tasks "Prepare Survey" and "Quality Control" are also marked in red. This is because all three of these tasks no longer have a buffer period available. If only one of these tasks is delayed, the end date of the overall process can no longer be met without intervention.
As the "Set Dates" task has a buffer period of one day to the next task, this task is not critical even if the last deadline of this process is scheduled in advance and is therefore not marked red.
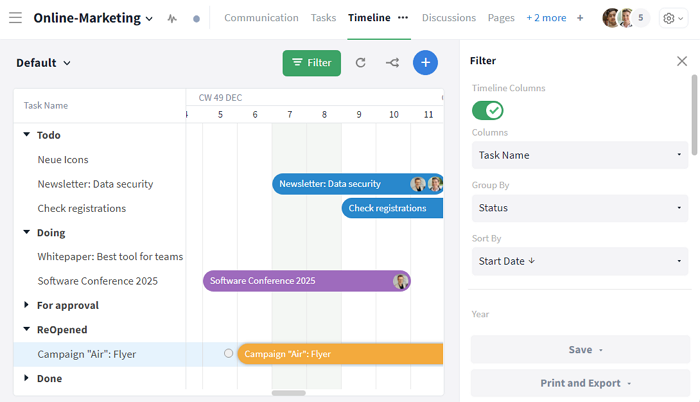
Customizing and filtering the Gantt view
The finished Gantt chart provides information about the total duration of the project / plan. The more extensive, the more extensive the view. For this reason, some functions can help to keep the view as clear as possible.
Summary of options already explained in the overview:
The other options of the schedule are shown below.
Adjusting the display period
Click on the corresponding buttons at the top of the view to switch between the weekly, monthly or annual view. Alternatively, this view can also be changed using the plus and minus magnifying glasses to the left.
The view jumps directly to the current day via the "Today" button on the far left.
If you want to look back or forward to a different year, this can be set using the "Year" filter option.
The display period can be influenced by several options
The scroll bars at the bottom and right end of the view can also be used to maneuver to the desired section or date. (Tip: Left/right movement with the left mouse button held down and up/down movement with the mouse wheel).
The start and end dates (see: Due date) still determine the respective limits, i. e. moving the view to the left or right is only possible up to the first or last entry in the Gantt chart.
Design through filter options
In the schedule overview, the filter options can be opened by clicking on the "Filter" button to the left of the blue plus symbol. The options listed below are available.
Filter options of the schedule
Columns:
If further information is to be displayed in addition to the bar / diamond symbols for mapping the entries, this is possible with the "Schedule columns" option. The columns can be (de)activated using the slider. After activation, a "Columns" selection list appears directly below, in which the desired options can be ticked.
The task list on the left-hand vertical axis then provides the most important key data for the respective tasks / milestones. This includes at least the title ("Task name") and optionally, for example, the start and end date as well as the duration.
Grouping of entries:
Via "Group by", tasks and milestones can be grouped together according to various criteria. Grouping is available by status or custom fields (→ Type: "Selection list" or "User") as well as by rooms in the reports.
As soon as at least the "Task name" column is displayed on the left, the group can be expanded / collapsed using the "Down arrow".
In this example, the group has been grouped according to status, with "To do" and the entries it contains collapsed and "For approval" collapsed. The order within the group is determined by the set sorting – here, for example, descending by start date.
Grouping by status
Order of the entries:
The "Sort by" option can be used to determine the order within the view. If the vertical arrangement of the displayed entries changes "unintentionally" in your eyes, this is due to the set sorting, which can also be changed to another criterion if required, e. g. alphabetically by the title of the task / milestone. (Note: The horizontal order is determined by the due date).
Limiting the entries displayed:
Only tasks and milestones of certain processing statuses, assigned persons or labels (→ the tasks, tasks and schedule module are interconnected and use the same labels) can be displayed, as well as for reports from certain rooms or room groups. Entries without the selected option are hidden when the filter is applied.
Interconnectivity within Stackfield
In Stackfield, no module stands alone. Rather, the modules are interconnected and changes made in one place are automatically applied to the other views.
- Milestones are highlighted with a corresponding label for quicker recognition in the Tasks module and in My Week.
(See no. 1 in the screenshot below)
- In the list view, dependencies can be displayed as an additional column and exported if required.
(See no. 2 in the screenshot below)
- In the Tasks module, milestones can be shown or hidden using filters and the "Milestones - Yes / No" option.
((See no. 3 in the screenshot below))
- In the project details of the project room there is an evaluation of the tasks / times. Milestones can be displayed in the timeline and, if necessary, called up via it.
- In the calendar, tasks are marked with a tick and milestones with a diamond.
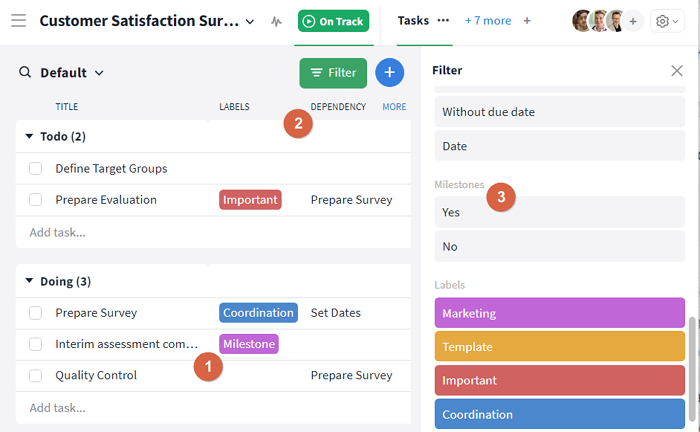
(1) Milestone label; (2) "Dependency" tab; (3) Filter option for milestones
Further articles